
2016 Census Program Content Test: Design and Results
2. Design
2.1 Overview
The test was designed to meet the following two main objectives: to assess the impact of any proposed content changes (objective no. 1) and to measure the impact of the SIN question (objective no. 2). To this end, two model questionnaires were developed to meet the objectives, namely a model with all the proposed changes EXCEPT the SIN question and a model with all the proposed changes INCLUDING the SIN question. A control model questionnaire with the 2011 content was also developed. Table 1 presents each of these model questionnaires.
| Model 1 | Model 2 | Control model | |
|---|---|---|---|
| Census | Nine mandatory questions with proposed changes | Ten mandatory questions with proposed changes, including the SIN question | Nine mandatory questions identical to those used in 2011 |
| National Household Survey (NHS) | Twenty-six voluntary questions, including proposed changes for collecting information on the following themes: activities of daily living, sociocultural information (immigration, Aboriginal identity, visible minority), mobility (1 year and 5 years), parents’ place of birth, education, labour market activities | Fifty-five questions identical to those used in 2011 | |
| Source: Statistics Canada, 2014 Content Test | |||
To adequately meet objective no. 2 and properly measure the SIN question’s impact on collection, the Content Test was mandatory for respondents. The mandatory aspect was required to make the conditions of the Content Test similar to those of the Census of Population (the census is mandatory). The mandatory aspect only applied to the census questions; the NHS questions were voluntary.
In total, the Content Test required developing different test and control forms, in English and in French, distributed among 11 analysis Panels. These 11 Panels were grouped to meet the two main objectives. Five Panels were used for objective no. 1 and six Panels were used for objective no. 2.
Questions included in models 1 and 2 of the NHS gave us the opportunity to evaluate potential changes to some questions and to evaluate a reduced content in the context of the greater use of administrative data and a reduction of response burden.
2.2 Target population and sampling
For each of the 11 Panels, a target population was defined and a sample was selected (see Figure 1). Due to the collection constraints of the test (for example, the absence of field staff to deliver the questionnaires), the sample was selected from private dwellings located in mail-out areas in one of the 10 provinces. Collective dwellings were excluded from this test, as were private dwellings located in list/leave areas or canvasser areas. Only households living in occupied private dwellings in 2011 which had responded to the NHS were targeted. This rule was adopted to maximize the number of test respondents who had also completed the NHS in 2011, to obtain more 2011 and 2014 responses for comparison among matched respondents. For the SIN test, it was not required to have responded to the NHS, since households that had not responded in 2011 were included in the target population.
The sampled dwellings of each Panel were selected to be representative of various target populations, for use in either the content analysis of objective no. 1 (Panels 1 to 5) or the SIN analysis of objective no. 2 (Panels 6 to 11). Of all the proposed changes, some only applied to the paper questionnaire (for example, the format of the paper questionnaire) and others only applied to the electronic questionnaire (EQ) (for example, electronic functionality). The target population and the collection method of the 11 Panels were defined to obtain a sufficient number of “paper” responses and a sufficient number of “electronic” responses to ensure that all the proposed changes were tested properly. This was required to obtain an adequate level of accuracy during data analysis to detect statistically significant differences by response mode (paper or EQ). Table 2 shows the target population and objective associated with each of the 11 Panels.
| Target population | Panels | Objectives |
|---|---|---|
| Households in mail-out areas that responded to the paper version of the NHS questionnaire in 2011 | Test Panels no. 1 and no. 2 vs. Control Panel no. 4 | Measure the impact of changes made to paper questionnaire |
| Households in mail-out areas that responded to the electronic version of the NHS questionnaire in 2011 | Test Panel no. 3 vs. Control Panel no. 5 | Measure the impact of changes made to electronic questionnaire and its functionality |
| Households in mail-out areas in 2011 | Test Panel no. 6 vs. Control Panel no. 9 Test Panel no. 7 vs. Control Panel no. 10 Test Panel no. 8 vs. Control Panel no. 11 |
Measure the impact of SIN question on quality, collection and potential matching with other data sources |
| Source: Statistics Canada, 2014 Content Test | ||
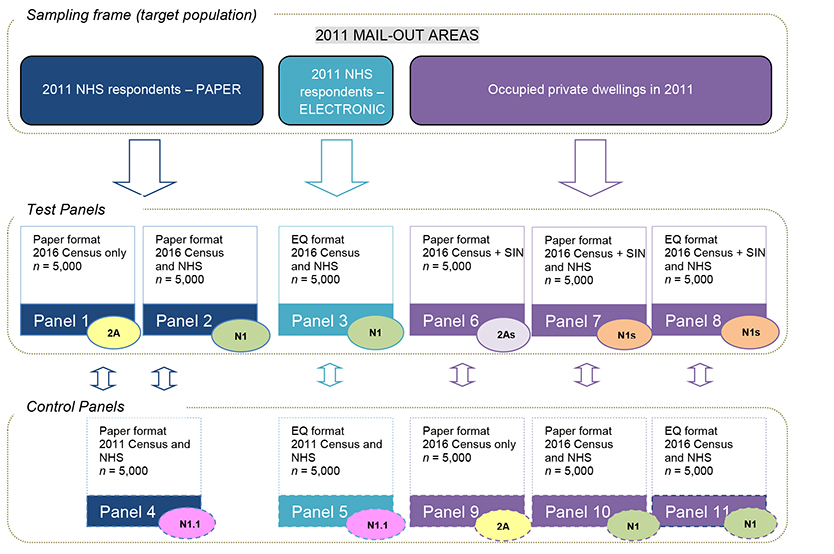
Figure 1 illustrates the design of each Panel and indicates whether it is a Test Panel (a Panel used for proposed changes) or a Control Panel. The description of each Panel also gives the target population (sampling frame), sample size (n), main type of questionnaire used (paper or EQ), form name (2A, N1, N1.1, 2As, N1s) and associated model questionnaire (see Table 1 for the various models). Form N1 was the form that integrated census questions and NHS questions for the Test Panels, and Form N1.1 was the form that integrated census questions and those of the NHS for the Control Panels.
Figure 1 Design of the 2014 Content Test
Description for figure 1
Figure 1 provides a summary description of the methodology for each panel of the 2014 Content Test. There is a box for each of the 11 panels and each box provides a summary of the methodology. The 11 panels of the figure are grouped into three groups according to the frame of the mail-out area portion which was used to select the sample. Samples of panels 1, 2 and 4 were selected from respondents to the 2011 NHS paper questionnaire. Samples of panels 3 and 5 were selected from respondents to the 2011 NHS electronic questionnaire. Samples of panels 6 to 11 were selected from private dwellings occupied in the 2011 Census.
Panel 1 is a test panel, with a sample of 5,000 dwellings, with a paper questionnaire named 2A and with the 2016 Census model.
Panel 2 is a test panel, with a sample of 5,000 dwellings, with a paper questionnaire named N1 and with the 2016 Census and 2016 NHS models.
Panel 3 is a test panel, with a sample of 5,000 dwellings, with an electronic questionnaire named N1 and with the 2016 Census and 2016 NHS models.
Panel 4 is a control panel, with a sample of 5,000 dwellings, with a paper questionnaire named N1.1 and with the 2011 Census and 2011 NHS models.
Panel 5 is a control panel, with a sample of 5,000 dwellings, with an electronic questionnaire named N1.1 and with the 2011 Census and 2011 NHS models.
Panel 6 is a test panel, with a sample of 5,000 dwellings, with a paper questionnaire named 2As and with the 2016 Census model plus a question on the Social Insurance Number.
Panel 7 is a test panel, with a sample of 5,000 dwellings, with a paper questionnaire named N1s and with the 2016 Census model plus a question about the Social Insurance Number and the 2016 NHS model.
Panel 8 is a test panel with a sample of 5,000 dwellings, with an electronic questionnaire named N1s and with the 2016 Census model plus a question about Social Insurance Number and the 2016 NHS model.
Panel 9 is a control panel, with a sample of 5,000 dwellings, with a paper questionnaire named 2A and with the 2016 Census model.
Panel 10 is a control panel, with a sample of 5,000 dwellings, with a paper questionnaire named N1 and with the 2016 Census and 2016 NHS models.
Panel 11 is a control panel, with a sample of 5,000 dwellings, with an electronic questionnaire named N1 and with the 2016 Census and 2016 NHS models.
For each of the Panels 1 to 5, the sample was a stratified simple random sample (stratified by province and language). For each of the Panels 6 to 11, to minimize non-response follow-up (NRFU) costs, the sample was first stratified by local census office; then, a total of 400 clusters (areas) were selected within the strata using systematic probability-proportional-to-size sampling. Lastly, a simple random sample of 75 dwellings was selected in each of the clusters.
2.2.1 Wave approach to the census
The wave approach was used for Content Test data collection. This approach made it possible to maximize response rates while minimizing collection costs. Table 3 shows the key dates for the various waves. This approach is very similar to the one used in the 2011 Census and the one planned for the 2016 Census.
| Collection stage | Main activity | Targeted panels | Start date |
|---|---|---|---|
| Wave 1 | Receipt of letter containing secure access code | EQ format Panels | May 5, 2014 |
| Receipt of questionnaire package | Paper format Panels | May 5, 2014 | |
| Wave 2 | Receipt of reminder letter containing secure access code | All non-responding households | May 13, 2014 |
| Wave 3 | Receipt of questionnaire package | EQ and paper format Panels: non-responding households in Wave 1 that received a letter | May 21, 2014 |
| NHS Wave | Receipt of reminder letter containing secure access code for NHS EQ only (“standalone” NHS EQ) | All EQ households that responded to the census portion but not to the NHS portion | May 30, 2014 |
| Wave 4 | Notices of visit and start of non-response follow-up (NRFU); personal visit and telephone | Panels for objective no. 2 (SIN): subsample of non-responding households | June 2, 2014 |
| Source: Statistics Canada, 2014 Content Test | |||
In total, 55,000 dwellings divided into 11 analysis Panels were contacted during the Content Test; 20,000 initial letters of invitation, 35,000 Wave 1 questionnaire envelopes and reminder letters were sent by Canada Post during these waves.
2.3 Data collection
Collection took place from May 2 to June 30, 2014. The reference date was May 13.
In addition to using the wave approach, other collection activities were put in place to promote the response rate. The Census Help Line (CHL) was open from May 2 to June 30, 2014. Those who had questions or who required assistance to complete their questionnaire could therefore talk to an agent. The CHL received 7,400 calls. When the call was to assist a respondent in completing his/her questionnaire, the agents used the application iEQ, which was an electronic questionnaire developed specifically for this purpose.
For respondents who received a letter containing a secure access code and who could not or did not wish to use the EQ, a paper questionnaire request system was implemented.
Non-response follow-up (NRFU) also took place from June 2 to June 30. NRFU only applied to the Panels used for SIN analysis. It was implemented to compare data collection when a SIN question was included (Panels 6, 7 and 8) with data collection when the SIN question was not included (Panels 9, 10 and 11). NRFU was carried out by Statistics Canada interviewers. The interviewers were required to contact households on all Panels that had not responded as of May 30, by telephone or through a personal interview. As a result of limited resources and a desire to control collection costs, the number of follow-ups was reduced by selecting a subsample of non-responding households.
2.4 Processing returned questionnaires
For the Content Test, EQs completed by respondents were sent directly to the servers at Statistics Canada’s Data Operations Centre (DOC) and saved automatically upon receipt. The paper questionnaires that were mailed back were also saved at the DOC by scanning the bar code on the cover of the questionnaire. The questionnaires completed by interviewers during NRFU were mailed to the DOC.
Once recorded, the paper questionnaires were processed for data capture.
2.5 Data processing
Paper questionnaire data were captured using ANYDOC, an optical character recognition data capture system. Once captured, the paper questionnaire data were combined with the EQ data in a single file. A complex integration process was required to standardize the data for each response mode. The purpose of this process was to obtain a single file for all response modes and all Panels. Processing rules were applied to this file to ensure that certain problems and inconsistencies were identified and corrected (for example, a paper questionnaire returned with no responses, or a paper questionnaire and an electronic questionnaire completed for the same household, etc.). An edit also made it possible to identify questionnaires containing no information or not enough information to proceed to the processing and analysis stages.
Given the resources available, the production schedule and the analysis objectives, the data were not subjected to the edit and imputation process. As well, write-in responses in the questionnaires were not coded.
2.6 Total response rate
This section deals with the household return rate of the Content Test. This rate is calculated from the number of completed questionnaires versus the number of dwellings selected. For the census portion, a questionnaire was considered completed if at least one question had been answered starting at Question 2 (Sex). For the NHS portion, a questionnaire was considered completed if at least one question pertaining to the NHS content had been answered. These rules are the same as the ones used in 2011. Table 4 shows the census return rates for the Content Test and SIN Test. Return rates were calculated based on the number of households who returned a fully or partially completed questionnaire divided by the total number of dwellings in the sample. The rates do not take into account unoccupied dwellings.
| Total questionnaires sent | Total questionnaires received | Return rate % | |
|---|---|---|---|
| Content Test (objective no. 1) | |||
| Test Panel (1) | 5,000 | 4,168 | 83.4 |
| Test Panel (2) | 5,000 | 4,163 | 83.3 |
| Control Panel (4) | 5,000 | 4,106 | 82.1 |
| Test Panel (3) | 5,000 | 4,122 | 82.4 |
| Control Panel (5) | 5,000 | 4,062 | 81.2 |
| SIN Test (objective no. 2) | |||
| Test Panel (6) | 5,000 | 4,424 | 88.5 |
| Control Panel (9) | 5,000 | 4,418 | 88.4 |
| Test Panel (7) | 5,000 | 4,386 | 87.7 |
| Control Panel (10) | 5,000 | 4,417 | 88.3 |
| Test Panel (8) | 5,000 | 4,408 | 88.2 |
| Control Panel (11) | 5,000 | 4,426 | 88.5 |
| Source: Statistics Canada, 2014 Content Test | |||
As indicated in Table 4, good census data collection results were obtained for the Content Test and the SIN Test, with return rates greater than 80% for all Panels and collection modes. The reason for these high participation rates is that the Content Test, even though considered a test, was mandatory, and the households selected for Panels 1 to 5 were also those that had responded voluntarily to the NHS in 2011. We must also take into consideration the fact that NRFU was implemented for the SIN Test (Panels 6 to 11) starting on June 2, which made it possible to gain the participation of approximately 2,400 additional households. Lastly, the wave methodology definitely contributed to the high numbers. Table 5 shows the NHS return rates for the Content Test and SIN Test.
| Total questionnaires sent | Total questionnaires received | Return rate % | |
|---|---|---|---|
| Content Test (objective no. 1) | |||
| Test Panel (2) | 5,000 | 3,974 | 79.5 |
| Control Panel (4) | 5,000 | 3,837 | 76.7 |
| Test Panel (3) | 5,000 | 3,398 | 68.0 |
| Control Panel (5) | 5,000 | 3,413 | 68.3 |
| SIN Test (objective no. 2) | |||
| Test Panel (7) | 5,000 | 3,963 | 79.3 |
| Control Panel (10) | 5,000 | 4,010 | 80.2 |
| Test Panel (8) | 5,000 | 3,679 | 73.6 |
| Control Panel (11) | 5,000 | 3,757 | 75.1 |
| Source: Statistics Canada, 2014 Content Test | |||
As for NHS return rates, the Content Test results and SIN Test results are slightly different. The former (Panels for content) vary from 73.6% to 80.2% whereas the latter (Panels for SIN), from 68% to 79.5%. Note that participation in the NHS was voluntary, which may explain the reason for these lower rates.
2.7 Analysis strategy
To perform the analysis of the data collected as part of the Content Test, a working group composed of subject-matter analysts, methodologists and representatives associated with the tasks of content determination and certification was created. This working group developed a plan for the analyses to be performed, specifying assumptions to be validated regarding the impact of the changes for each content change as well as the work required to develop the response database, and derive the variables required for the analysis. Methods of comparison were also defined and validated by the working group. An independent analysis plan, specific to the addition of the SIN question, was also developed.
For purposes of analysis and assumption validation, the results of the test and Control Panels were compared to assess the impact of the proposed content changes. Responses from the paper questionnaires and electronic questionnaires were analyzed separately. The analysis mainly focused on the impact of the changes on the distribution of responses and non-response rates.
For changes to the existing content, the results of the test and Control Panels were compared and the differences were evaluated. For the new questions, the results of the Test Panel were compared with the results of the Control Panel to ensure that the questions did not have an effect on neighbouring questions in the questionnaire or on other related questions. To verify data accuracy and consistency, were also compared the test and Control Panels results of the questions without changes.
Results of the Control Panels were also analyzed and compared to data from the 2011 Census. Since the content of the Control Panels was similar to the one in 2011, summary analysis were conducted between data from the Control Panels and data from 2011 to make sure that data distributions and quality were similar.
Data
A database combining electronic and paper collection modes and containing clean data and sampling weights allowed us to do content-related analysis (objective no. 1).
For the SIN Test analysis (objective no. 2), an independent database, including the sampling weights with a restricted access to those involved in the analysis, was created.
Furthermore, the test data were matched with 2011 Census and NHS data. So, for respondents living in the same household as during the 2011 Census, the responses provided in the 2014 Test were compared to those provided in 2011, to gain a better understanding of potential variations in the data and to provide a more thorough analysis of data on the proposed changes.
- Date modified: